Demographic Variables and TV Narrative
A statistician wanted to determine if the demographic variables of age, education, and income influence the number of hours of television watched per week. A random sample of 25 adults was selected to estimate the multiple regression model:  , where y is the number of hours of television watched last week,
  is the age (in years),
  is the number of years of education, and
  is income (in $1000s). The computer output is shown below.
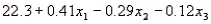
The regression equation is 
 S = 4.51 R-Sq = 34.8%
Analysis of Variance 
-Refer to Demographic Variables and TV Narrative. Test the overall validity of the model at the 5% significance level.
Definitions:
Price Elasticity
A metric determining how the quantity of a good demanded fluctuates with a shift in that good's price.
Quantity Demanded
The total amount of goods or services that consumers are willing to buy at a given price over a certain period.
Inelastic
Describes a situation where the demand or supply for a good or service is relatively unaffected by changes in price.
Midpoint Method
A technique used to calculate the elasticity of demand or supply, offering a more accurate measure by averaging the beginning and end prices and quantities.
Q12: In a simple linear regression model, testing
Q13: Refer to Sales and Experience Narrative. Interpret
Q20: In testing the validity of a multiple
Q37: If the sum of squares for error
Q52: Refer to Randomized Block Design Narrative. How
Q67: In a multiple regression model, the partial
Q91: In a Kruskal-Wallis test, there are four
Q112: A three-variable multiple regression plane is positioned
Q124: The Wilcoxon rank sum test is a
Q129: In regression analysis, to what does the