Random samples of size n were selected from three populations with the means and variances given here:
i. 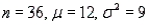 ii.
ii. 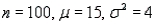 iii.
iii. 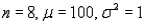
a. Find the mean and standard deviation of the sampling distribution of the sample mean in each of the three cases above.
b. If the sampled populations are normal, are the sampling distributions of  for each of the three cases also normal? Justify your answer.
c. According to the Central Limit Theorem, if the sampled populations are NOT normal, what can be said about the sampling distribution of  for each of the three cases?
Definitions:
Process Standard Deviation
A measure of variability or dispersion in a process or system, showing how much variation exists from the average.
Control Limits
Statistical boundaries within a control chart that signal the range of variability expected in a process's stable and controlled state.
Proportion
is a mathematical concept that denotes a part, share, or number considered in comparative relation to a whole.
Standard Deviation
A measure of the amount of variation or dispersion of a set of values, indicating how much the values in a data set deviate from the mean.
Q9: The error of estimation is the distance
Q9: If a hypothesis test is to be
Q23: Which of the following are possible options
Q45: A Canadian Medical Association study showed that
Q65: A two-tailed test of hypothesis for a
Q91: The c chart is another commonly used
Q124: From a group of ten bank officers,
Q129: A binomial experiment requires that the success
Q163: The taste test for PTC (phenylthiourea) is
Q173: Refer to Weights of Candy Bars Narrative.