Refer to the following figure when answering the following questions.
Figure 16.5: U.S. Household Net Worth 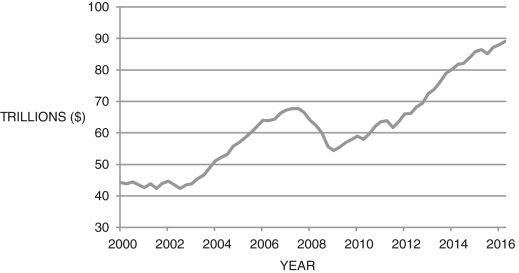
-Based on Figure 16.5, personal savings generally ________ over the period. However, personal savings ________ between roughly 2007 and 2009, which was likely due to ________.
Definitions:
Labor Demand
The total number of hours of employment that employers are willing to hire at a given wage rate, in a specific period.
Labor Supply
The total hours that workers are willing and able to work at a given wage rate in a specific time period.
Realistic Job Preview
Background information about a job's positive and negative qualities.
On-Campus Interviewing
A recruiting process where employers visit colleges and universities to conduct interviews with students for potential employment opportunities.
Q3: In 2015, the largest single source of
Q3: Monetary economists find that it takes anywhere
Q8: Consider Figure 18.2. What was the cause
Q52: The American Recovery and Reinvestment Act is
Q61: Consider Figure 20.2. If _ is the
Q71: Economic forecasters use the term structure of
Q84: Which of the following represents the consumer's
Q121: In the text, inflation is given by
Q131: Consider Figure 12.2. If the Fed raises
Q138: Use the aggregate supply/aggregate demand model in