Refer to the following figure when answering the following questions.
Figure 12.10: Output Gap: 1990-2000 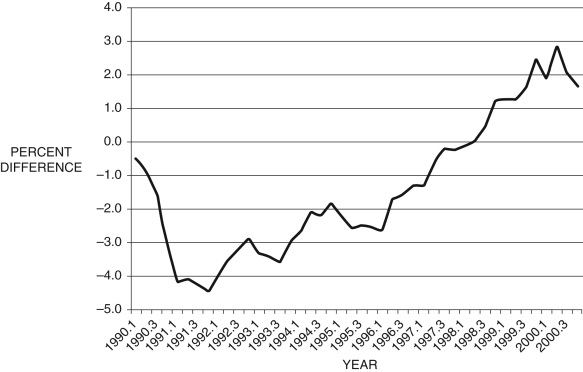
-Consider Figure 12.10, which shows the output gap  from 1990 to 2000, by quarter. If this is all the information you have, during the period 1993.1-1993.4, from the Phillips curve, you would conclude that:
Definitions:
Q1: The short-run model is built on which
Q3: Consider Figure 13.1, beginning at point e.
Q19: According to the Phillips curve presented in
Q26: U.S. government spending on goods and services
Q42: According to Federal Reserve Bank of Minneapolis
Q52: Which of the following shifts the aggregate
Q53: Based on Figure 16.5, personal savings generally
Q75: The most immediate and visible form of
Q102: Consider Figure 13.4. The terrorist attacks on
Q112: If the rate of inflation is -2