Consider Figure 11.8 below, which shows the output gap and the NASDAQ stock market index from 1995-2001. NASDAQ has a lot of "tech" firms that drove the rise in the stock market index in the late 1990s, as shown. As one can see, the output gap also rose to about 2.8 percent in April 2000. Explain this graph using the IS curve.Figure 11.8: Output Gap and NASDQ Index 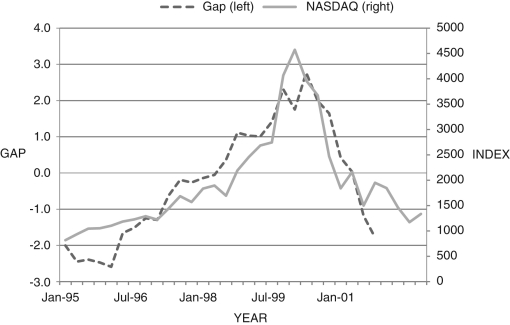
Definitions:
Q14: The average unemployment benefit of an American
Q14: Briefly discuss the Fed's balance sheet before
Q28: IMF studies conducted after the financial crisis
Q43: With sticky nominal wages, a monetary expansion
Q49: During the 2000s, Americans dramatically increased their
Q55: Which of the following contributed to high
Q66: In standard circumstances a firm _ when
Q87: Consider Figure 13.1. Holding the inflation rate
Q105: Which of the following financial institutions converted
Q119: One explanation for the college wage premium