You are given the U.S. employment data in Figure 9.3 below by your uncle, and he is curious to know what was happening to the economy in 1996-2000 and 2007-2009. You might not remember, but you tell him you can explain what happened to the employment rate, the output gap, and inflation. What do you tell him? Your uncle likes economics, so some mathematical relationships would probably help your argument.Figure 9.3: Percent Change in U.S. Employment: 1980-2015 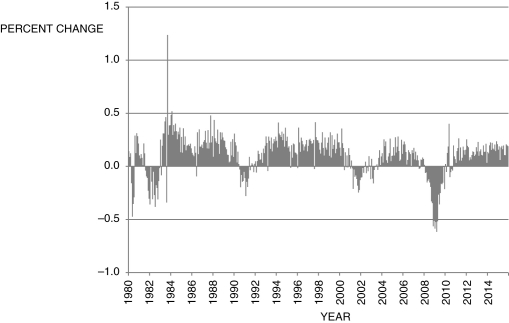
Definitions:
Herfindahl Index
The Herfindahl Index is a measure of market concentration used to determine the intensity of competition within an industry, calculated by summing the squares of the market shares of all firms within the market.
Import Competition
The pressure on domestic companies from foreign producers offering goods or services in the same market.
Herfindahl Index
A measure of market concentration that squares and then sums the market share percentages of all firms within the industry.
Market Shares
The proportion of a market controlled by a particular company, product, or service in relation to total sales in the market.
Q16: Consider Figure 12.9. You are Federal Reserve
Q28: Between 2009 and 2015, the federal funds
Q34: The economywide rate of inflation is given
Q58: Consider the growth accounting data in table
Q63: Consider the growth accounting data in Table
Q88: In the Romer model, with decreasing returns
Q95: In terms of loss of employment, which
Q97: If current output is <img src="https://d2lvgg3v3hfg70.cloudfront.net/TB6622/.jpg" alt="If
Q109: When the dot-com bubble burst, it pushed
Q133: In the Phillips curve, <img src="https://d2lvgg3v3hfg70.cloudfront.net/TB6622/.jpg" alt="In