Figure 9.8: Cyclical Unemployment: 1980-2015 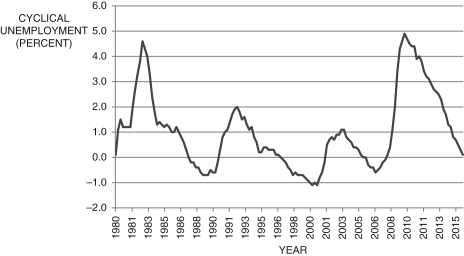 (Source: Federal Reserve Economic Data, St. Louis Federal Reserve)
-The figure above shows cyclical unemployment for the years 1980-2015. Using your best guess by looking at the figure, what was the output gap in 1992, 2003, 2010, and 2015? What is the change in inflation for those years?
Definitions:
Resources
Assets and inputs used to produce goods and services, such as time, labor, capital, and natural resources.
Factor Market
The marketplace for services of the factors of production (labor, land, capital) where these are bought and sold.
Circular-Flow Diagram
A visual representation emphasizing the economic interactions and monetary flow between households and firms within various markets.
Households
Units of individuals living together, typically sharing living expenses, and making joint decisions on consumption and financial matters.
Q2: An implication of sticky inflation is that,
Q8: Consider Figure 7.5. If the demand curve
Q24: In economics, a rival good is one
Q39: In the Solow model, investment, I<sub>t</sub>, as
Q53: Among the world as a whole, there
Q54: Between May 2004 and May 2006, the
Q65: When the investment bank Bear Stearns collapsed,
Q82: In the IS curve, <img src="https://d2lvgg3v3hfg70.cloudfront.net/TB6622/.jpg" alt="In
Q88: The equation used to predict movements in
Q113: Recent energy legislation that dictates increased use