Multiple Choice
Refer to the following figure when answering the following questions.
Figure 9.2: U.S. Output Fluctuations 1960-2015 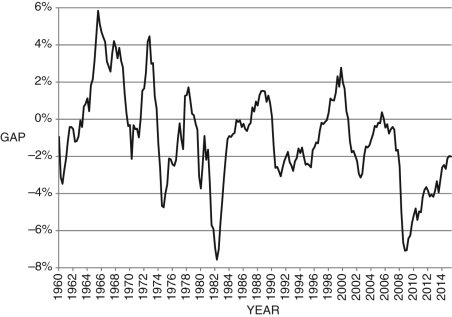
-Consider Figure 9.2. In approximately what years did the U.S. economy experience its longest economic downturn, using the text's definition of a recessionary gap?
Definitions:
Related Questions
Q13: The labor demand curve is derived from
Q25: Unemployment in the Great Recession peaked at
Q40: The president of Tunisia asks you to
Q43: Which of the following scenarios best describes
Q60: The bank's net worth is equal to:<br>A)
Q62: In most advanced economies, central banks target
Q83: Figure 12.18 shows quarterly real GDP and
Q84: The costs associated with changing prices in
Q87: Starting at any equilibrium in Figure 12.12,
Q96: The _ was hastily designed to _