The figure below shows the three-month bond yield (solid line) and the inflation rate (dashed). Discuss what has happened to the real three-month bond yield over the period shown, 2003-2015. Are there any "unusual" occurrences over this period?Figure 8.3: Nominal Three-Month Yield and Inflation 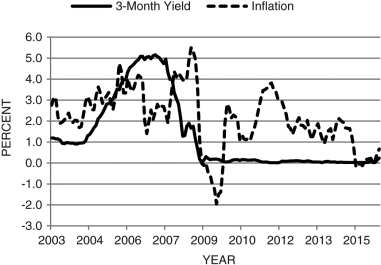
Definitions:
Q4: The key insight in the Solow model
Q18: In the Romer model, the growth rate
Q22: In the Solow model, if <img src="https://d2lvgg3v3hfg70.cloudfront.net/TB6622/.jpg"
Q44: The production function used in the Solow
Q45: A decrease in the income tax will
Q49: During the 2000s, Americans dramatically increased their
Q61: An increase in the income tax causes
Q65: Consider Figure 11.7 of the life-cycle hypothesis.
Q66: In the Solow model, defining <img src="https://d2lvgg3v3hfg70.cloudfront.net/TB6622/.jpg"
Q93: In economics, a nonrival good is one