Table 8.3 contains the following variables, growth rates of real GDP, M1, M2, velocity of M1 and M2 (denoted V1 and V2), the federal funds rate (FFR), and the CPI inflation rate. Use the quantity equation to calculate the equilibrium inflation rate using individually M1 and M2. Next, calculate the equilibrium inflation rate assuming the quantity theory of money holds. According to your calculations, which is a better predictor of inflation, M1 or M2? Similarly, which is a better predictor of inflation, assuming the quantity theory holds, or not?Table 8.3: Growth Rates 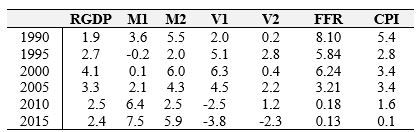
(Source: FRED II, St. Louis Federal Reserve)
Definitions:
Learning Curve
The graphical representation of how an individual, group, or system's performance improves over time as a result of gaining experience or efficiency.
Learning Rate
The speed at which a person acquires knowledge or skill over time, often analyzed in the context of production and cost efficiency.
Learning Curves
A graphical representation of how an increase in learning or experience leads to improved performance or efficiency over time.
Bid Preparation
The process involved in compiling and submitting the documentation and estimates required to compete for a contract or project.
Q11: Consider the following model of the IS
Q35: Using Figure 7.1, Which of the following
Q51: As an economist working at the International
Q54: In Figure 5.1, at K<sub>1</sub>, net investment
Q83: In the quantity equation, the value P<sub>t</sub>Y<sub>t</sub>
Q89: If the inflation rate is larger than
Q95: The Fed has perfect information about the
Q96: The marginal product of the labor curve
Q101: In the equation <img src="https://d2lvgg3v3hfg70.cloudfront.net/TB6622/.jpg" alt="In the
Q111: If the depreciation and saving rates are