Refer to the following figure to answer the following questions.
Figure 7.1: U.S. Unemployment Rate: 1975-2015 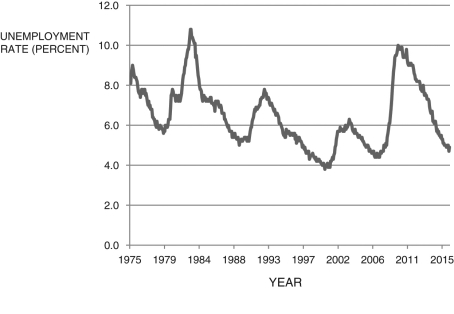 (Source: U.S. Bureau of Labor Statistics)
-Using Figure 7.1, The approximate year of the peak of the boom was:
Definitions:
Per Capita
A statistical measure that divides an aggregate by the number of individuals in the population, commonly used to express economic indicators.
Household Production
The creation of goods and services within a home for the use by its members, which replaces or supplements the purchase of products and services from the market.
Illegal Production
Refers to the manufacturing or production of goods and services that violate laws or regulations, often involving prohibited substances or activities.
GDP Deflator
A measure of the level of prices of all new, domestically produced, final goods and services in an economy, used to adjust GDP for inflation.
Q24: The Solow model of economic growth:<br>A) endogenizes
Q48: The fundamental lesson of the life-cycle and
Q53: In the labor market, the intersection of
Q83: If reserve requirements are 3 percent and
Q87: According to the classical dichotomy, in the
Q90: In the text, Okun's law is given
Q95: If the income taxes on wages increase,
Q109: What is the relationship between the real
Q115: If you withdraw $100 from your checking
Q122: In the Solow model, it is assumed