Refer to the following figure when answering the following questions.
Figure 7.2: United Kingdom Unemployment Rate: 1971-2015 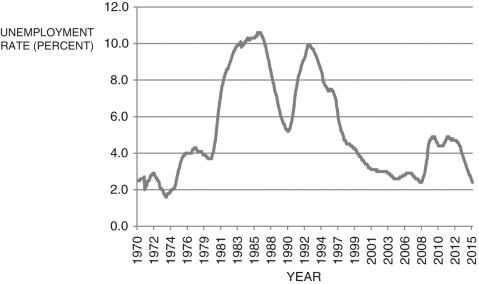 (Source: OECD and Federal Reserve Economic Data, Federal Reserve Bank of St. Louis)
-Given the U.K. unemployment rate data depicted in Figure 7.2, the year of the trough of a recession was:
Definitions:
Q21: The Great Recession began in _ and
Q35: In the steady state, output per person
Q38: What country or countries do the following
Q40: Explain the relationships between the global savings
Q81: What is the industry Mr. McGuire advises
Q86: You are a staff economist with the
Q87: If the production function is given by
Q97: This bank's liabilities are equal to:<br>A) $9,600.<br>B)
Q103: In the Solow model, if investment is
Q111: Consider Table 7.1. Between 2010 and 2015,