Multiple Choice
Figure 6.2: Romer Model: Per Capita Output 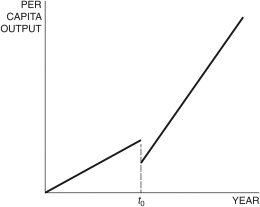
-In the Romer model in Figure 6.2, at time t0, a change in the shape of the production function can be explained by an increase in the:
Definitions:
Related Questions
Q10: If we calculate the real GDP using
Q19: In the combined Solow-Romer model, the growth
Q24: In economics, a rival good is one
Q32: The labor market determines the:<br>A) equilibrium wage.<br>B)
Q46: If the production function is given by
Q62: In the labor market depicted in Figure
Q63: Net exports are also called:<br>A) capital outflows.<br>B)
Q97: If MPL <span class="ql-formula"
Q101: In 2009 prices, U.S. per capita GDP
Q122: The text uses this analogy of the