Refer to the following figure when answering the following questions.
Figure 5.5: Solow Diagram 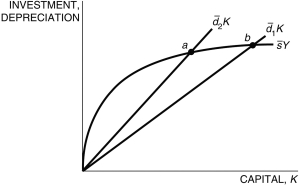
-Consider the Solow model exhibited in Figure 5.5. Which of the following is/are true?
i. If 1 denotes Country 1 and 2 denotes Country 2, Country 1 has a higher saving rate.
ii. If 1 denotes Country 1 and 2 denotes Country 2, Country 1 has a lower depreciation rate.
iii. If 1 denotes Country 1 and 2 denotes Country 2, Country 2 has a lower steady state.
Definitions:
Q5: A decline in the saving rate causes
Q14: Over the past 30 years, _ has
Q23: Institutions are one example of factors that
Q28: The Solow model of economic growth endogenizes
Q46: The "idea" of the assembly line leads
Q61: Suppose you put $100 in the bank
Q68: Consider the three production functions in Figure
Q72: The president of the World Bank has
Q92: Household consumption as a share of GDP
Q100: As of December 31, 2012, Grove Corporation