Refer to the following table when answering the following questions.
Table 4.1: Production Model's Prediction for Per Capita GDP (US = 1) 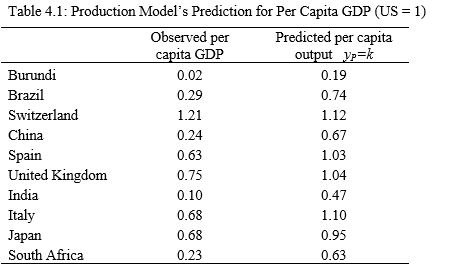 (Source: Penn World Tables 9.0)
-Considering the data in Table 4.1, the explanation for the difference between the predicted and actual level of output is called ________. If you compare India's observed and predicted output, this difference is equal to ________.
Definitions:
Good News
Information or messages that are positive, favorable, or beneficial in nature, often leading to happiness or satisfaction.
Direct Approach
A communication method where the main point is stated at the beginning, followed by supporting details, often used in business writing.
Routine Communications
Regular, everyday exchanges of information that follow established patterns or procedures.
Neutral
Impartial or unbiased; not favoring one side more than another.
Q6: Which of the following is/are NOT included
Q21: Suppose k grows at a rate of
Q27: Income per person began at _ in
Q55: Because of fixed R&D costs, _ are
Q88: Horizontal analysis is also known as:<br>A)Liquidity analysis.<br>B)Absolute
Q95: A surprising result of the Solow model
Q98: Which measure of overall economic activity was
Q101: Many companies have to monitor some of
Q105: The parameter(s) in the Romer model is/are
Q116: Which ratio measures how effectively a company