Figure 4.6: Production Function 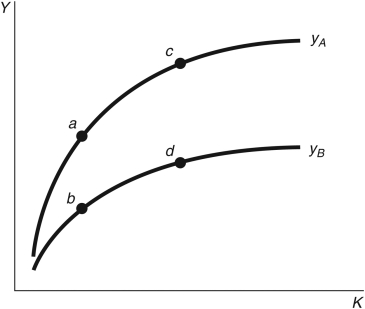
-Consider the two production functions in Figure 4.6, representing two countries. Which of the following is true?
i. At points a and b, each country has the same per capita capital stock but different factor
Productivity.
ii. Points a and c represent the same country but with different factor productivity.
iii. Points b and d represent the same country but with different stock of per capita capital.
Definitions:
Refrigerators
Appliances used for keeping food and drinks cold.
Range
Range in statistics refers to the difference between the highest and lowest values in a dataset, indicating the spread of the data.
Interquartile Range
The statistical measure of middle fifty percent of a data set, calculated as the difference between the 75th and 25th percentiles.
Test Scores
Quantitative measurements that represent a person's level of achievement or proficiency in a given subject or skill.
Q16: In the combined Solow-Romer model, the total
Q38: According to data presented in the text,
Q39: Consider Figure 4.3. The shape of this
Q60: In the Romer model, if an economy
Q67: An economy's _ is/are equal to its
Q81: Research on the effects of war on
Q94: Between 1986 and 2014, India's per capita
Q102: If you put $100 in the bank
Q129: A model is a(n) _ representation of
Q133: The Destin Company reported net income of