Multiple Choice
Which of the following graphs illustrates the relationship between the level of Nanos protein and the translation of hunchback mRNA in the Drosophila embryo? 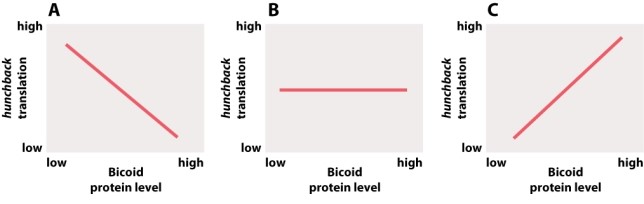
Definitions:
Related Questions
Q11: Transcriptional activator proteins in prokaryotes can experience
Q22: Which of the following statements is TRUE
Q25: In the graph shown here, the dashed
Q89: Which of the following statements is TRUE
Q100: What would you expect to happen if
Q101: A bacteriologist is studying two asexually reproducing
Q113: Male birds of different species sing species-specific
Q129: Imagine you are looking at a bottle
Q178: A new mutation is discovered in Drosophila
Q181: With four distinct nucleotides, how many combinations