In the graph shown here, the dashed line shows the level of mRNA for a certain protein, Prot4, at various positions along the anterior-posterior axis of an insect embryo. The solid line represents the level of a regulatory protein that controls translation of the Prot4 mRNA. 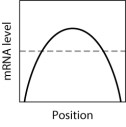 If the regulatory protein stimulates translation of the Prot4 mRNA, then which graph shows the expected level of Prot4 across the embryo?
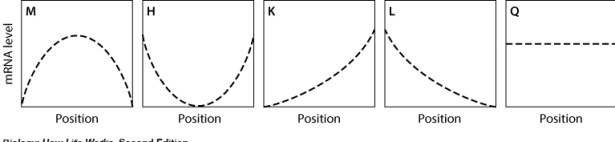
Definitions:
Q6: Which of the following is a benefit
Q11: One key principle of natural selection is
Q49: The developmental pathway of each whorl of
Q74: Because of hydrogen bonding, water is uniquely
Q76: Gene regulation by means of epigenetic mechanisms
Q96: According to Figure 23.2 below, the most
Q121: Imagine that a researcher is studying two
Q123: Bicoid protein is a transcription factor that
Q152: In Caenorhabditis elegans vulval development, the fate
Q195: Which of the following are multipotent cell