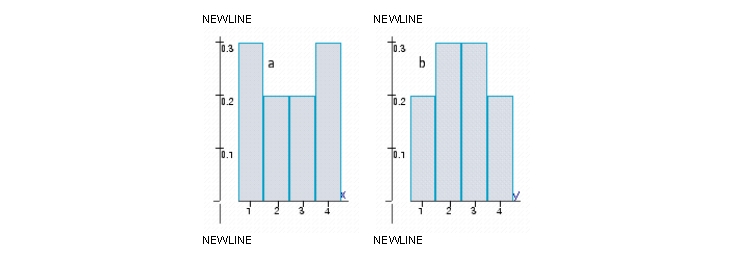
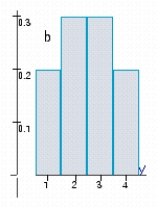
The histograms represent the probability distributions of the random variables X and Y. Determine by inspection which probability distribution has the larger variance. 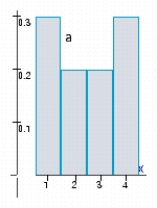
Definitions:
Frequency Distribution
A summary of how often different values occur within a data set, typically organized into a table or represented graphically.
Percent Frequency
The frequency of a specific event or category expressed as a percentage of the total number of events or categories.
Frequency Distribution
A summary of data showing the frequency (or number) of observations in each of several non-overlapping categories or bins.
Class Width
The difference between the upper and lower boundaries (or real limits) of any class/interval in a frequency distribution.
Q87: An automobile manufacturer obtains the microprocessor used
Q134: Let <img src="https://d2lvgg3v3hfg70.cloudfront.net/TB6027/.jpg" alt="Let and
Q158: Applicants for temporary office work at Carter
Q173: In a survey of 380 households regarding
Q185: The scores on an Economics examination are
Q188: An opinion poll was conducted among a
Q223: Rosa Walters is considering investing $10,000 in
Q230: An experiment consists of casting an six-sided
Q237: A pair of fair dice is cast.
Q253: Determine whether the given experiment has a