A quality analyst wants to construct a sample mean chart for controlling a packaging process.He knows from past experience that the process standard deviation is two ounces.Each day last week,he randomly selected four packages and weighed each.The data from that activity appear below.
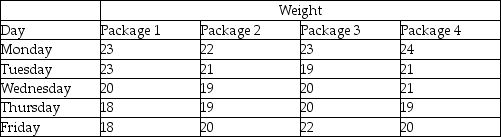 (a)Calculate all sample means and the mean of all sample means.
(b)Calculate upper and lower 2-sigma x-bar chart control limits that allow for natural variations.
(c)Based on the x-bar chart,is this process in control?
Definitions:
Total Product Curve
A graphical representation showing how the total quantity of output produced by a firm varies with the quantity of a single variable input, holding other inputs constant.
Average Total Cost Curve
A graph that represents the total cost of production (fixed and variable costs combined) divided by the quantity of output produced, at various levels of output.
Diffusion
The spread of an innovation through its widespread imitation.
Q8: Which of the following product development strategies
Q15: An organization's approach to transforming resources into
Q18: Which of these statements regarding Regal Marine
Q24: What is a poka-yoke? Give an example.
Q31: Why do modern operations managers look for
Q37: The x-bar chart indicates that a gain
Q60: An assembly line is assigned as follows.Station
Q79: A Three Sigma program has how many
Q87: Improved quality can increase profitability via allowing
Q120: What forecasting systems combine the intelligence of