Figure 7.1 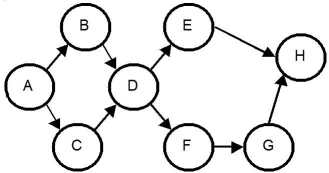
-Use the information in Figure 7.1.If each task has a work time of one minute and there are 8 hours in a day,what is the task assignment at the first station if 160 units should be produced each day?
Definitions:
Graph
A diagram showing the relationship between variable quantities, typically represented as lines, bars, or sectors.
Visual
Relating to the ability to see or the process of being seen; often involves graphical or pictorial representation.
Plant Scale
The size or capacity of a manufacturing, production, or processing plant, determining its output volume.
Projected Timeline
An estimated schedule outlining when specific milestones or objectives are expected to be achieved in the future.
Q6: The movement of product from one station
Q11: Using the information in Table 6.4,if Lee
Q35: A milling operation has historically produced an
Q88: One chart commonly used for quality measures
Q101: Quality measured with reference to price is
Q125: Use the information in Case 8.3.How many
Q132: Use the information in Table 7.8.Using the
Q187: Which one of the following statements concerning
Q198: A metal-cutting operation has a target value
Q223: Which of the following would be considered