Table 5.1
Factors for Calculating Three-Sigma Limits for the  Chart and R-Chart
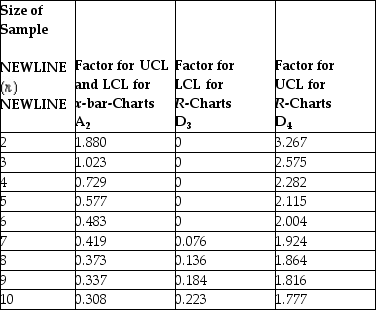 Source: 1950 ASTM Manual on Quality Control of Materials,copyright American Society for Testing Materials.Reprinted with permission.
-A milling operation has historically produced an average thickness of 0.005 inch with an average range of 0.0015 inch.Currently,the first three items from each batch of 20 are inspected.Use Table 5.1.What is the value of lower control limit for the x-bar chart if the sample size is increased to 6?
Definitions:
Q22: With TOC,_ are scheduled to maximize their
Q38: Cross-functional coordination is at particular risk where:<br>A)there
Q47: A(n)_ is a bar chart on which
Q48: Genichi Taguchi first combined engineering and statistical
Q48: The authors discuss seven mistakes when managing
Q91: Use the information from Table 7.10.The theoretical
Q101: Use the information in Scenario B.1.What is
Q109: Formal work measurement techniques estimate average times
Q162: When a process fails to satisfy a
Q165: _ is represented in a process flow