Using time-series data,the demand function for a profit-maximizing monopolist has been estimated as  where
where  is the amount sold,P is price,M is income,and
  is the price of a related good.The estimated values for M and
  in 2014 are $25,000 and $200,respectively.The short-run marginal cost curve for this firm has been estimated as:
 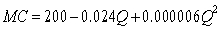 Total fixed cost is forecast to be $500,000 in 2016.The forecasted demand function for 2016 is:
Definitions:
Q5: A forecaster used the regression equation <img
Q6: A consulting company estimated market demand and
Q20: A forecaster used the regression equation <img
Q24: <img src="https://d2lvgg3v3hfg70.cloudfront.net/TB2562/.jpg" alt=" In the figure
Q25: In the graph below,the price of capital
Q35: Consider a competitive industry and a price-taking
Q37: The expansion path<br>A)shows how the cost-minimizing input
Q65: Which of the following is NOT a
Q81: In an assembly operation at a furniture
Q92: A price-setting firm faces the following estimated