Multiple Choice
The graph below shows demand and marginal cost for a perfectly competitive firm.If the firm is producing 300 units of output,decreasing output by one unit would ______ the firm's profit by $______. 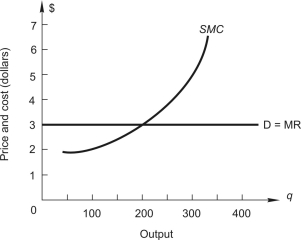
Definitions:
Related Questions
Q10: According to the above figure,why doesn't the
Q13: A municipal water utility employs quasi-fixed capital
Q20: Which of the following is NOT a
Q24: <img src="https://d2lvgg3v3hfg70.cloudfront.net/TB2562/.jpg" alt=" In the figure
Q25: The managers of Alpha and Beta must
Q49: The cost and demand conditions for residential
Q49: The short-run market supply in a perfectly
Q55: Firms that employ exceptionally productive resources<br>A)have lower
Q62: Suppose a firm is hiring 20 workers
Q64: Refer to the following figure.At a price