The following graph shows the marginal and average product curves for labor,the firm's only variable input.The monthly wage for labor is $2,800.Fixed cost is $160,000. 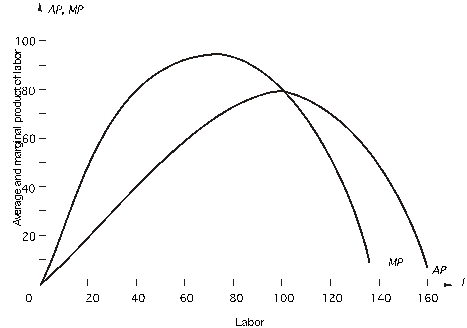 When the firm uses 40 units of labor,what is marginal cost at this level of output?
Definitions:
Craft Unions
Labor unions that represent workers specialized in particular crafts or trades, focusing on skills and qualifications rather than the industry or sector.
Elasticity of Demand
A measure of how much the quantity demanded of a good responds to a change in the price of that good, with all other factors being held constant.
Immigration
The act of moving to a new country or region with the intention of settling there.
Wage Earnings
Income received by an individual in return for labor or services performed, usually calculated on an hourly, daily, or piecework basis.
Q1: Refer to the following figure.The price of
Q8: Use the following general linear supply function:
Q12: If a supply curve goes through the
Q26: Based on the above graph,if income is
Q39: Straker Industries estimated its short-run costs using
Q40: In the long run<br>A)all inputs are fixed.<br>B)a
Q40: A manager in charge of new product
Q42: A cubic specification for a short-run production
Q88: When choosing a priority sequencing rule:<br>A)select multiple-dimension
Q88: If the price of labor rises relative