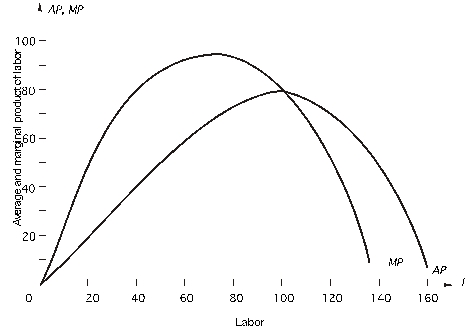
The following graph shows the marginal and average product curves for labor,the firm's only variable input.The monthly wage for labor is $2,800.Fixed cost is $160,000.  When the firm uses 40 units of labor,how much output does it produce?
Definitions:
Fixed Costs
Expenditures that do not vary with the degree of output or sales, for instance, rental fees, wages, and insurance premiums.
Break-Even Point
The point at which total costs and total revenues are equal, meaning a business is not making a profit but also not incurring a loss.
Margin of Safety
The difference between actual or projected sales and the break-even sales level, used to assess risk and financial stability.
Variable Costs
Financial outlays that adjust based on the quantity of products made or the scale of sales transactions.
Q17: A consulting company estimated market demand and
Q28: Use the following table to answer the
Q29: In a perfectly competitive market,<br>A)a firm can
Q42: Burger Doodle,the incumbent firm,wishes to set a
Q46: Refer to the figure below: <img src="https://d2lvgg3v3hfg70.cloudfront.net/TB2562/.jpg"
Q59: Sonoma Vineyards reduces the price of its
Q60: Diseconomies of scale<br>A)exist when fixed cost increases
Q61: Qualitative forecasting methods<br>A)use higher quality data than
Q84: Use the following table to answer the
Q104: Using time-series data,the demand function for a