A forecaster used the regression equation 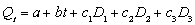 and quarterly sales data for 1996I-2013IV t = 1,...,64) for an appliance manufacturer to obtain the results shown below.Q is quarterly sales,and
  and
and  are dummy variables for quarters I,II,and III.
  What is the estimated intercept of the trend line in the fourth quarter?
Definitions:
Q7: Use the following demand and supply functions:
Q11: Refer to the following figure.When quantity demanded
Q21: Based on the above graph,if U<sub>1</sub> is
Q23: an unconstrained maximization problem<br>A)the decision maker seeks
Q33: Using Figure K.4,what is the rectilinear distance
Q36: Use the following demand and supply functions:
Q37: Given the table below,what is average total
Q47: In a perfectly competitive market<br>A)a firm faces
Q63: In which of the following cases will
Q63: In a competitive industry the market-determined price