Table A.2
Use the following to answer the questions below.
A company that is introducing a new product has to choose between four different manufacturing methods,referred to as methods A,B,C and D.Depending on the demand for the product,they forecast different levels of expenses for the year (values are in thousands) .The company has identified three possible states of nature for economic growth,and named them High,Medium,and Low.
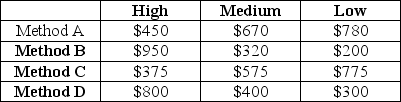
-Using the information in Table A.2,which alternative is BEST if further study revealed that the probability of high growth is 0.2,the probability of medium growth is 0.5,and the probability of low growth is 0.3?
Definitions:
Indifference Curve
An indifference curve represents a graphical depiction of different bundles of goods between which a consumer is indifferent, reflecting their preferences for those goods' combinations.
Mean-Standard Deviation Graph
A graphical representation used in finance to show the risk (standard deviation) and return (mean) of different investments.
Utility Function
A mathematical representation of a decision-maker's preference ranking for a set of outcomes or goods, reflecting their attitude towards risk.
Expected Utility
The anticipated value derived from an uncertain outcome, where utility represents a measure of relative satisfaction or benefit.
Q8: Use the information in Table 13.4.What is
Q9: Use the information in Table D.1.Given the
Q16: Refer to Figure 10-1.Which is the best
Q20: What are the elements of the SCOR
Q28: A single-sampling plan by attributes is needed
Q36: In an economic production lot size situation,the
Q42: McKenna Restaurant wishes to open a new
Q50: Which of the following statements regarding linear
Q56: The _ is the volume at which
Q84: If a new alternative is added to