Multiple Choice
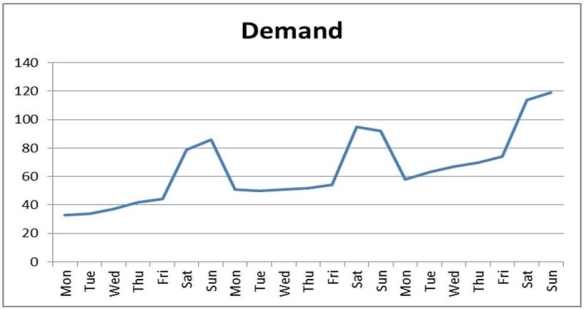
Graph 8.1
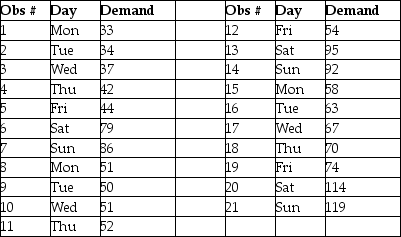
Data plotted in the graph appear in the table below.


-Refer to Graph 8.1. What is the average seasonal index for the Sundays in the data set?
Definitions:
Related Questions
Q28: When determining the number of kanban containers,discuss
Q28: Using Table 7.6,what is the latest start
Q32: Use the information in Table 5.1.Using the
Q34: Consider the following conditions for an item
Q59: Use the information from Table 5.7 to
Q88: _ occurs when inventory is stolen by
Q89: Diseconomies of scale is a concept that
Q101: _ is the amount of time a
Q111: The judgment methods of forecasting are to
Q139: Which of the following statements about the