Table 5.11
Factors for Calculating Three-Sigma Limits for the  Chart and R-Chart
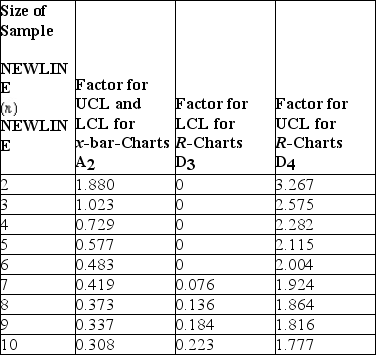 Source: 1950 ASTM Manual on Quality Control of Materials,copyright American Society for Testing Materials.Reprinted with permission.
-Thermostats are subjected to rigorous testing before they are shipped to air conditioning technicians around the world.Results from the last five samples are shown in the table.Create control charts that will fully monitor the process and indicate the result of X-bar and R chart analysis. 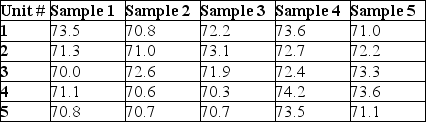
Definitions:
Organizational Resources
Assets, including financial, human, and material resources, that an organization utilizes to operate effectively and achieve its goals.
Socially Responsible
The ethical framework suggesting that entities, either individuals or organizations, have an obligation to act for the benefit of society at large.
Competitive Advantage
A condition or circumstance that puts a company in a superior business position compared to its competitors.
Ethnic Diversity
The inclusion of individuals from different ethnic backgrounds within a community or organization.
Q6: Name the two competitive priorities for quality
Q8: Which of the following statements regarding organizational
Q15: Which of these statements about processes is
Q17: In a drum-buffer-rope system,the lot size that
Q32: A firm that rewards the achievement of
Q87: What factors should be considered when selecting
Q107: Use the information in Table 5.5.How many
Q126: A value stream map shows the flows
Q140: _ involves using an organizational unit with
Q245: An undergraduate business student studies diligently in