The following figure shows the domestic demand and supply curves for a good. With free trade, the price of the good in the domestic market is P3. The government introduces a 5% tariff in the market which raises the domestic price to P2.
Figure 7-1
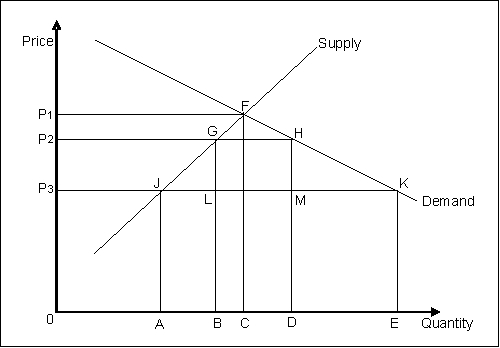
-Refer to Figure 7-1. With the imposition of the tariff, the change in producer surplus is equal to:
Definitions:
Free-Rider Problem
A scenario wherein some individuals benefit from resources or services without contributing to the cost or effort involved in providing them, leading to potential under-provision of those goods.
Interest Groups
Organizations formed by individuals united by a common political, economic, or social goal that try to influence public policy and government actions.
Lobbyists
Individuals or groups who seek to influence political decisions and policies, often representing specific interests or industries.
Legislation Influence
The impact or effect that individuals, groups, or events can have on the creation or amendment of laws.
Q6: A firm will maximize profits and revenues
Q10: The table gives the short-run production
Q15: Meredith told the management team that Gregor
Q27: Which of the following is true in
Q30: The key source of energy in an
Q34: George Stigler, a Nobel laureate in economics,
Q35: Mathematically explain the relationship between marginal revenue
Q40: Refer to Figure 8-1. The efficient level
Q41: Adverse selection occurs in a market when:<br>A)
Q73: In Change Competency: According to Gregg Steinhafel,