Use the following to answer question: 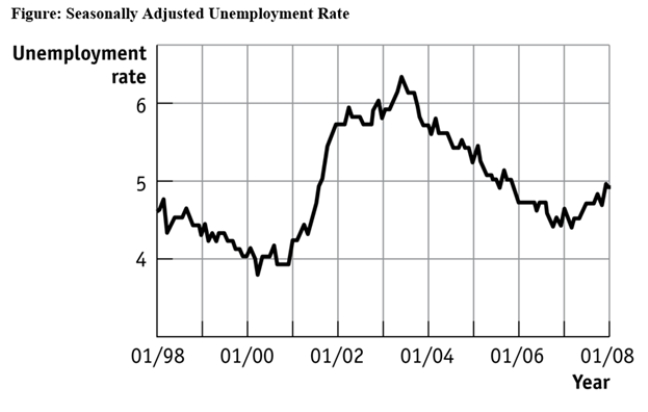
-(Figure: Seasonally Adjusted Unemployment Rate) Use Figure: Seasonally Adjusted Unemployment Rate.The distance between each labeled point on the horizontal axis is one year,and the distance between each labeled point on the vertical axis is one percentage point of unemployment.What is the approximate slope of the graph between 1/2004 and 1/2006 (using percentage point and years as the units on the vertical and horizontal axes,respectively) ?
Definitions:
Percent of Sales Method
A financial analysis technique used to forecast future expenses or account balances as a percentage of sales revenue.
Direct Write-off Method
An accounting method where uncollectible accounts receivable are written off directly against income at the time they are deemed noncollectible.
Uncollectible Receivables
Receivables considered uncollectible by a company and therefore recorded as a loss.
Journalize
The process of recording transactions in the general journal using the double-entry bookkeeping system.
Q2: (Figure: Equilibrium in the Labor Market)Use Figure:
Q49: (Table: Price,Quantity Demanded,and Quantity Supplied)Use Table: Price,Quantity
Q53: In building models,economists avoid making any assumptions
Q55: Which of the following is sold in
Q56: Taylor sees a bar graph showing the
Q77: According to the marginal productivity theory of
Q180: (Scenario: Linear Production Possibility Frontier)Use Scenario: Linear
Q184: (Figure: Strawberries and Submarines II)Use Figure: Strawberries
Q220: The opportunity cost of an hour of
Q262: A firm is an organization that produces