Multiple Choice
Table 15-2
Given the sample results (100 units in each sample) :
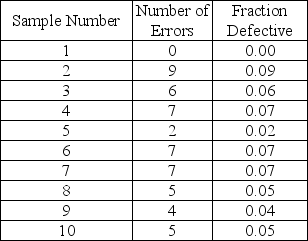
-Based on Table 15-2, find the 95.5% lower limit of the appropriate p-chart.
Definitions:
Related Questions
Q2: A prediction equation for starting salaries (in
Q6: The number of cell phone minutes used
Q44: There is a tutoring lab at a
Q51: Using Table 12-6, what is the average
Q55: Use the information in Table 13-7 to
Q58: A large school district is reevaluating its
Q59: A new shopping mall is considering setting
Q70: Samples sizes of five are often used
Q94: In Markov analysis it is assumed that
Q100: A study was done to determine the