TABLE 17-9
What are the factors that determine the acceleration time (in sec.)from 0 to 60 miles per hour of a car? Data on the following variables for 171 different vehicle models were collected:
Accel Time: Acceleration time in sec.
Cargo Vol: Cargo volume in cu.ft.
HP: Horsepower
MPG: Miles per gallon
SUV: 1 if the vehicle model is an SUV with Coupe as the base when SUV and Sedan are both 0
Sedan: 1 if the vehicle model is a sedan with Coupe as the base when SUV and Sedan are both 0
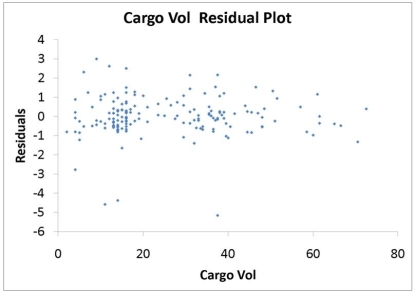
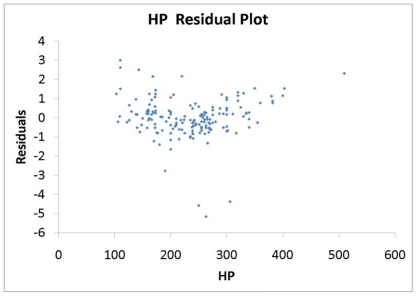
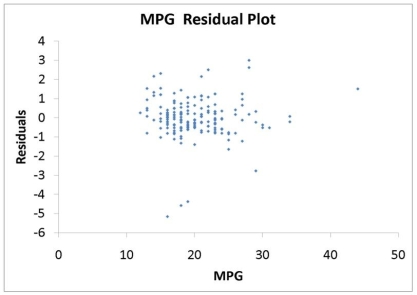
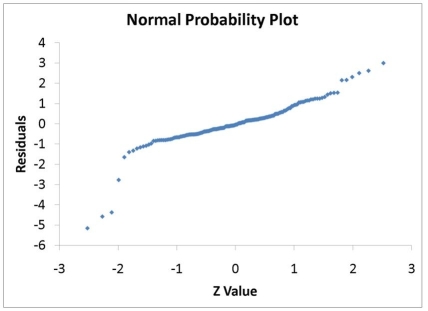
The regression results using acceleration time as the dependent variable and the remaining variables as the independent variables are presented below. 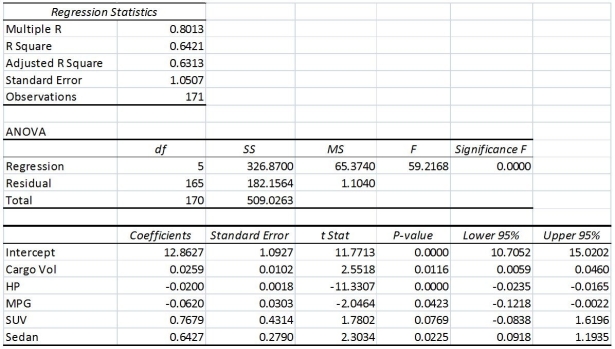 The various residual plots are as shown below.
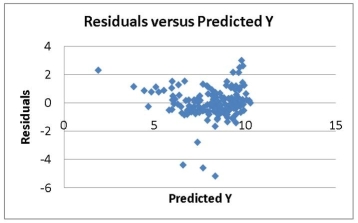
 The coefficient of partial determination (
  )of each of the 5 predictors are,respectively,0.0380,0.4376,0.0248,0.0188,and 0.0312.
The coefficient of multiple determination for the regression model using each of the 5 variables Xj as the dependent variable and all other X variables as independent variables (  )are,respectively,0.7461,0.5676,0.6764,0.8582,0.6632.
-Referring to Table 17-9,what is the p-value of the test statistic to determine whether MPG makes a significant contribution to the regression model in the presence of the other independent variables at a 5% level of significance?
Definitions:
Dual Distribution
A strategy where a manufacturer sells products through multiple distribution channels, often including directly to consumers and through resellers or agents.
Distribution Density
The extent of a product's availability across a geographic area or within a distribution network, influencing market saturation.
Marketing Channels
Pathways through which a company's products or services are distributed to reach the consumer, including both direct and indirect channels.
Corporate Vertical Marketing Systems
A structured form of marketing systems where a single corporation controls multiple levels of production, distribution, and sales within its supply chain.
Q16: True or False: Referring to Table 15-6,the
Q33: True or False: Referring to Table 15-4,the
Q46: True or False: Referring to Table 17-12,there
Q73: The logarithm transformation can be used<br>A)to overcome
Q80: Referring to Table 16-13,what is your estimated
Q119: Referring to Table 18-7,an R chart is
Q128: Referring to Table 14-1,for these data,what is
Q218: Referring to Table 14-5,one company in the
Q225: Referring to Table 14-3,when the economist used
Q245: An investor wanted to forecast the price