TABLE 17-10
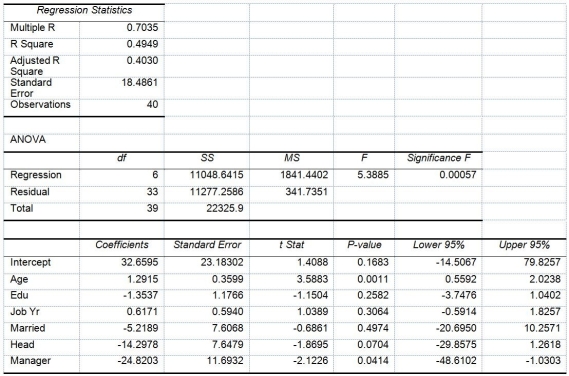
Given below are results from the regression analysis where the dependent variable is the number of weeks a worker is unemployed due to a layoff (Unemploy)and the independent variables are the age of the worker (Age),the number of years of education received (Edu),the number of years at the previous job (Job Yr),a dummy variable for marital status (Married: 1 = married,0 = otherwise),a dummy variable for head of household (Head: 1 = yes,0 = no)and a dummy variable for management position (Manager: 1 = yes,0 = no).We shall call this Model 1.The coefficient of partial determination (  )of each of the 6 predictors are,respectively,0.2807,0.0386,0.0317,0.0141,0.0958,and 0.1201.
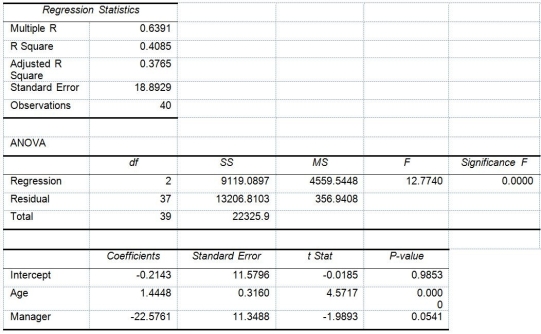
  Model 2 is the regression analysis where the dependent variable is Unemploy and the independent variables are Age and Manager.The results of the regression analysis are given below:
-Referring to Table 17-10,Model 1,what are the lower and upper limits of the 95% confidence interval estimate for the effect of a one year increase in education received on the mean number of weeks a worker is unemployed due to a layoff after taking into consideration the effect of all the other independent variables?
Definitions:
Cerebral Palsy
A neurological disorder caused by brain damage, often before or during birth, that affects muscle coordination and body movement.
Spina Bifida
A birth defect where there is incomplete closing of the backbone and membranes around the spinal cord.
Muscular System
The bodily system consisting of skeletal, smooth, and cardiac muscles, responsible for movement, posture, and vital processes.
Cerebral Palsy
A neurological disorder that appears in infancy or early childhood and permanently affects body movement and muscle coordination.
Q25: Referring to Table 15-6,what is the value
Q26: Referring to Table 14-4,the value of the
Q50: True or False: Referring to Table 18-8,based
Q54: Variation signaled by individual fluctuations or patterns
Q95: In portfolio analysis,the _ is the reciprocal
Q147: Referring to Table 17-8,what is the standard
Q191: Referring to Table 17-5,to test the significance
Q196: Referring to Table 17-10,Model 1,what is the
Q281: Referring to Table 17-8,what is the p-value
Q306: Referring to Table 14-3,to test for the