TABLE 17-10
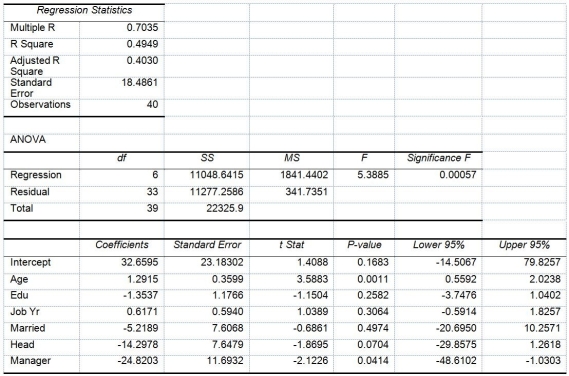
Given below are results from the regression analysis where the dependent variable is the number of weeks a worker is unemployed due to a layoff (Unemploy)and the independent variables are the age of the worker (Age),the number of years of education received (Edu),the number of years at the previous job (Job Yr),a dummy variable for marital status (Married: 1 = married,0 = otherwise),a dummy variable for head of household (Head: 1 = yes,0 = no)and a dummy variable for management position (Manager: 1 = yes,0 = no).We shall call this Model 1.The coefficient of partial determination (  )of each of the 6 predictors are,respectively,0.2807,0.0386,0.0317,0.0141,0.0958,and 0.1201.
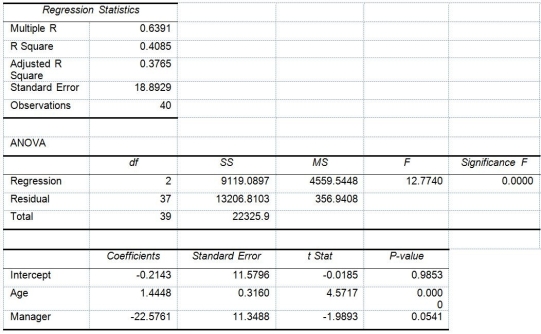
  Model 2 is the regression analysis where the dependent variable is Unemploy and the independent variables are Age and Manager.The results of the regression analysis are given below:
-True or False: Referring to Table 17-10,Model 1,we can conclude that,holding constant the effect of the other independent variables,there is a difference in the mean number of weeks a worker is unemployed due to a layoff between a worker who is married and one who is not at a 5% level of significance if we use only the information of the 95% confidence interval estimate for β4.
Definitions:
Correlation
A numerical indicator that captures how much two variables move in tandem, showing both how strong their linkage is and in what direction it lies.
Risk-adjusted Discount Rates
Discount rates that are adjusted to reflect the risk of an investment, used in calculating the present value of expected future cash flows.
Unsystematic Risk
The risk associated with a specific company or industry, which can be reduced through diversification.
Diversifiable Risk
A type of investment risk that can be reduced or eliminated through the use of diversification strategies across different assets or asset classes.
Q26: True or False: In stepwise regression,an independent
Q34: Referring to Table 19-5,what is the opportunity
Q50: Referring to Table 16-5,the number of arrivals
Q59: Referring to Table 18-9,construct an R chart
Q66: Referring to Table 19-6,how many possible events
Q100: Referring to Table 18-3,suppose the analyst constructs
Q107: Referring to Table 18-5,a p control chart
Q156: Referring to Table 14-5,what are the predicted
Q161: True or False: Given a data set
Q187: Referring to Table 17-12,which of the following