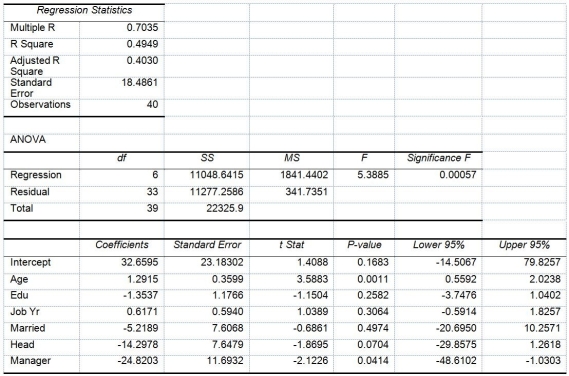
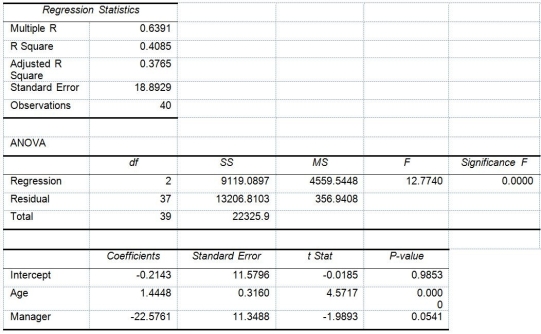
TABLE 17-10
Given below are results from the regression analysis where the dependent variable is the number of weeks a worker is unemployed due to a layoff (Unemploy)and the independent variables are the age of the worker (Age),the number of years of education received (Edu),the number of years at the previous job (Job Yr),a dummy variable for marital status (Married: 1 = married,0 = otherwise),a dummy variable for head of household (Head: 1 = yes,0 = no)and a dummy variable for management position (Manager: 1 = yes,0 = no).We shall call this Model 1.The coefficient of partial determination (  )of each of the 6 predictors are,respectively,0.2807,0.0386,0.0317,0.0141,0.0958,and 0.1201.
  Model 2 is the regression analysis where the dependent variable is Unemploy and the independent variables are Age and Manager.The results of the regression analysis are given below:
-True or False: Referring to Table 17-10,Model 1,there is sufficient evidence that being married or not makes a difference in the mean number of weeks a worker is unemployed due to a layoff while holding constant the effect of all the other independent variables at a 10% level of significance.
Definitions:
Interstate Commerce Commission
The first federal agency created in 1887, designed to regulate the railroads and later other modes of transportation, ensuring fair rates and practices.
Census Bureau
A principal agency of the U.S. Federal Statistical System responsible for producing data about the American people and economy, notably through the decennial census.
Labor and Capital
Describes the economic and social relationship between workers (labor) and the owners of businesses (capital).
Q11: Referring to Table 16-4,a centered 3-year moving
Q12: Referring to Table 16-15,what are the simple
Q17: What occurs in the first phase of
Q27: True or False: The Paasche price index
Q66: Referring to Table 15-6,what is the value
Q87: Referring to Table 16-12,the best interpretation of
Q94: The difference between expected payoff under certainty
Q220: Referring to Table 17-10,Model 1,_ of the
Q225: True or False: Referring to Table 17-8,you
Q245: An investor wanted to forecast the price