Examlex

Solved

TABLE 17-10 Given Below Are Results from the Regression Analysis Where the Where

question 216

True/False

TABLE 17-10
Given below are results from the regression analysis where the dependent variable is the number of weeks a worker is unemployed due to a layoff (Unemploy)and the independent variables are the age of the worker (Age),the number of years of education received (Edu),the number of years at the previous job (Job Yr),a dummy variable for marital status (Married: 1 = married,0 = otherwise),a dummy variable for head of household (Head: 1 = yes,0 = no)and a dummy variable for management position (Manager: 1 = yes,0 = no).We shall call this Model 1.The coefficient of partial determination ( TABLE 17-10 Given below are results from the regression analysis where the dependent variable is the number of weeks a worker is unemployed due to a layoff (Unemploy)and the independent variables are the age of the worker (Age),the number of years of education received (Edu),the number of years at the previous job (Job Yr),a dummy variable for marital status (Married: 1 = married,0 = otherwise),a dummy variable for head of household (Head: 1 = yes,0 = no)and a dummy variable for management position (Manager: 1 = yes,0 = no).We shall call this Model 1.The coefficient of partial determination (   )of each of the 6 predictors are,respectively,0.2807,0.0386,0.0317,0.0141,0.0958,and 0.1201.   Model 2 is the regression analysis where the dependent variable is Unemploy and the independent variables are Age and Manager.The results of the regression analysis are given below:   -True or False: Referring to Table 17-10,Model 1,we can conclude that,holding constant the effect of the other independent variables,there is a difference in the mean number of weeks a worker is unemployed due to a layoff between a worker who is married and one who is not at a 10% level of significance if we use only the information of the 95% confidence interval estimate for<sub> </sub>β<sub>4</sub>. )of each of the 6 predictors are,respectively,0.2807,0.0386,0.0317,0.0141,0.0958,and 0.1201. TABLE 17-10 Given below are results from the regression analysis where the dependent variable is the number of weeks a worker is unemployed due to a layoff (Unemploy)and the independent variables are the age of the worker (Age),the number of years of education received (Edu),the number of years at the previous job (Job Yr),a dummy variable for marital status (Married: 1 = married,0 = otherwise),a dummy variable for head of household (Head: 1 = yes,0 = no)and a dummy variable for management position (Manager: 1 = yes,0 = no).We shall call this Model 1.The coefficient of partial determination (   )of each of the 6 predictors are,respectively,0.2807,0.0386,0.0317,0.0141,0.0958,and 0.1201.   Model 2 is the regression analysis where the dependent variable is Unemploy and the independent variables are Age and Manager.The results of the regression analysis are given below:   -True or False: Referring to Table 17-10,Model 1,we can conclude that,holding constant the effect of the other independent variables,there is a difference in the mean number of weeks a worker is unemployed due to a layoff between a worker who is married and one who is not at a 10% level of significance if we use only the information of the 95% confidence interval estimate for<sub> </sub>β<sub>4</sub>. Model 2 is the regression analysis where the dependent variable is Unemploy and the independent variables are Age and Manager.The results of the regression analysis are given below: TABLE 17-10 Given below are results from the regression analysis where the dependent variable is the number of weeks a worker is unemployed due to a layoff (Unemploy)and the independent variables are the age of the worker (Age),the number of years of education received (Edu),the number of years at the previous job (Job Yr),a dummy variable for marital status (Married: 1 = married,0 = otherwise),a dummy variable for head of household (Head: 1 = yes,0 = no)and a dummy variable for management position (Manager: 1 = yes,0 = no).We shall call this Model 1.The coefficient of partial determination (   )of each of the 6 predictors are,respectively,0.2807,0.0386,0.0317,0.0141,0.0958,and 0.1201.   Model 2 is the regression analysis where the dependent variable is Unemploy and the independent variables are Age and Manager.The results of the regression analysis are given below:   -True or False: Referring to Table 17-10,Model 1,we can conclude that,holding constant the effect of the other independent variables,there is a difference in the mean number of weeks a worker is unemployed due to a layoff between a worker who is married and one who is not at a 10% level of significance if we use only the information of the 95% confidence interval estimate for<sub> </sub>β<sub>4</sub>.
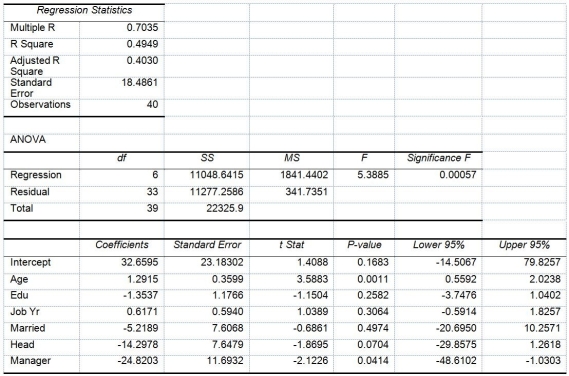
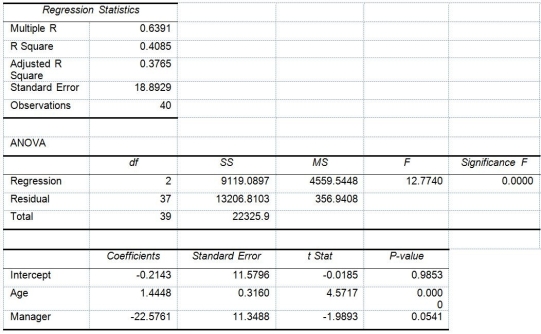
-True or False: Referring to Table 17-10,Model 1,we can conclude that,holding constant the effect of the other independent variables,there is a difference in the mean number of weeks a worker is unemployed due to a layoff between a worker who is married and one who is not at a 10% level of significance if we use only the information of the 95% confidence interval estimate for β4.


Definitions:

Sampling Variability

The extent to which the statistic obtained from different samples for the same population varies.

Sample Mean

The average value of a set of observations sampled from a larger population.

Normally Distributed

A data distribution that is symmetrically shaped like a bell curve, with most data points clustering around a central mean value.

Sampling Distribution

The probability distribution of a statistic based on a large number of samples or simulations.

Related Questions