TABLE 17-10
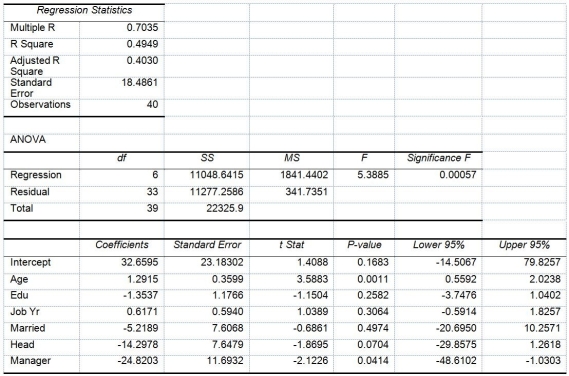
Given below are results from the regression analysis where the dependent variable is the number of weeks a worker is unemployed due to a layoff (Unemploy)and the independent variables are the age of the worker (Age),the number of years of education received (Edu),the number of years at the previous job (Job Yr),a dummy variable for marital status (Married: 1 = married,0 = otherwise),a dummy variable for head of household (Head: 1 = yes,0 = no)and a dummy variable for management position (Manager: 1 = yes,0 = no).We shall call this Model 1.The coefficient of partial determination (  )of each of the 6 predictors are,respectively,0.2807,0.0386,0.0317,0.0141,0.0958,and 0.1201.
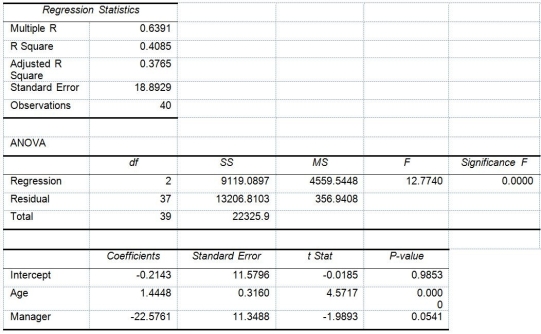
  Model 2 is the regression analysis where the dependent variable is Unemploy and the independent variables are Age and Manager.The results of the regression analysis are given below:
-True or False: Referring to Table 17-10 and using both Model 1 and Model 2,there is sufficient evidence to conclude that the independent variables that are not significant individually are also not significant as a group in explaining the variation in the dependent variable at a 5% level of significance.
Definitions:
American Psyche
The collective psychology or mindset of the American people, shaped by historical, cultural, and social influences.
Bodies
The physical structure of a person or organism, often referenced in discussions about health, identity, and beauty.
Literature
Written works, especially those considered of superior or lasting artistic merit, including novels, poetry, and plays.
Women of Color
A term referring to women of non-White racial or ethnic backgrounds, emphasizing their unique experiences and struggles.
Q28: Referring to Table 16-16,what are the simple
Q37: Referring to Table 16-16,what is the unweighted
Q38: Which of the following will not change
Q39: Referring to Table 16-8,the forecast for profits
Q54: Referring to Table 19-4,what is the return
Q87: Referring to Table 16-12,the best interpretation of
Q88: True or False: Referring to Table 15-6,the
Q94: Referring to Table 17-3,the p-value of the
Q158: Referring to Table 16-8,the fitted value for
Q305: Referring to Table 14-7,the department head wants