TABLE 17-1
A real estate builder wishes to determine how house size (House) is influenced by family income (Income) ,family size (Size) ,and education of the head of household (School) .House size is measured in hundreds of square feet,income is measured in thousands of dollars,and education is in years.The builder randomly selected 50 families and ran the multiple regression.Microsoft Excel output is provided below: 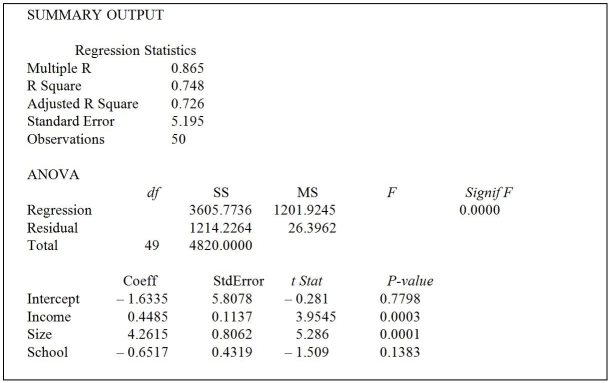
-Referring to Table 17-1,what minimum annual income would an individual with a family size of 9 and 10 years of education need to attain a predicted 5,000 square foot home (House = 50) ?
Definitions:
Demand Curve
A graphical representation of the relationship between the price of a good and the quantity demanded by consumers.
Price Elasticity
A measure of how much the quantity demanded of a good responds to a change in its price, with higher elasticity indicating greater sensitivity.
Elastic
Describes demand that is highly responsive to changes in price, where a small price change leads to a large change in quantity demanded.
Inelastic
Describes a scenario where the demand or supply of a good or service is not significantly changed when the price of that good or service changes.
Q18: A manager of a product sales group
Q18: True or False: The Paasche price index
Q21: Kitchens identifies three types of family interventions.Which
Q41: Referring to Table 19-5,what is the opportunity
Q60: Referring to Table 19-6,what is the expected
Q99: Referring to Table 16-5,exponentially smooth the number
Q107: Referring to Table 17-12,what is the p-value
Q125: Referring to Table 18-4,suppose the supervisor constructs
Q136: Referring to Table 17-12,what is the p-value
Q206: True or False: Referring to Table 17-10,Model