TABLE 17-10
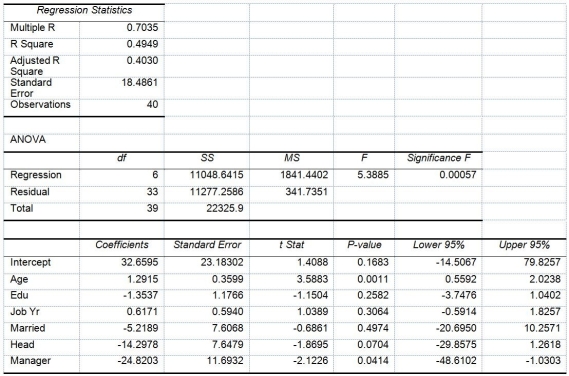
Given below are results from the regression analysis where the dependent variable is the number of weeks a worker is unemployed due to a layoff (Unemploy)and the independent variables are the age of the worker (Age),the number of years of education received (Edu),the number of years at the previous job (Job Yr),a dummy variable for marital status (Married: 1 = married,0 = otherwise),a dummy variable for head of household (Head: 1 = yes,0 = no)and a dummy variable for management position (Manager: 1 = yes,0 = no).We shall call this Model 1.The coefficient of partial determination (  )of each of the 6 predictors are,respectively,0.2807,0.0386,0.0317,0.0141,0.0958,and 0.1201.
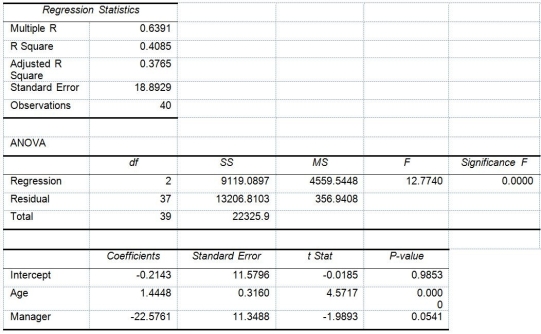
  Model 2 is the regression analysis where the dependent variable is Unemploy and the independent variables are Age and Manager.The results of the regression analysis are given below:
-Referring to Table 17-10 and using both Model 1 and Model 2,what are the null and alternative hypotheses for testing whether the independent variables that are not significant individually are also not significant as a group in explaining the variation in the dependent variable at a 5% level of significance?
Definitions:
Utility
The measure of the welfare or satisfaction of an investor.
Treasury Bills
Short-term government securities issued at a discount from their face value and maturing in one year or less, representing a secure, low-risk investment option.
Interest Rate Fluctuations
Variations in the interest rates over time, affecting borrowing costs and investment returns.
Inflation Uncertainty
The unpredictability regarding the rate at which the general level of prices for goods and services is rising, and subsequently, how purchasing power is being eroded.
Q11: True or False: Referring to Table 18-6,the
Q17: Referring to Table 16-16,what is the unweighted
Q20: Referring to Table 16-12,to obtain a fitted
Q24: Referring to Table 16-12,to obtain the fitted
Q27: Referring to Table 18-4,what is the value
Q27: True or False: The method of least
Q163: Referring to Table 16-10,the fitted values for
Q195: True or False: Referring to Table 17-10
Q276: True or False: Referring to Table 17-10,Model
Q331: True or False: Consider a regression in