TABLE 16-13
Given below is the monthly time-series data for U.S.retail sales of building materials over a specific year. 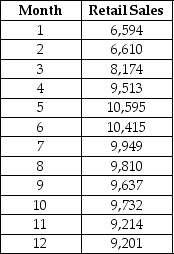 The results of the linear trend,quadratic trend,exponential trend,first-order autoregressive,second-order autoregressive and third-order autoregressive model are presented below in which the coded month for the 1st month is 0:
Linear trend model: 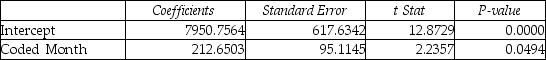 Quadratic trend model:
 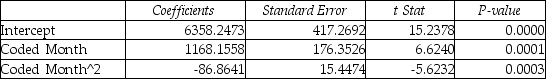 Exponential trend model:
 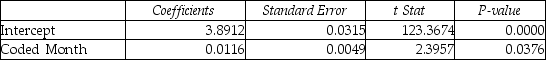 First-order autoregressive:
 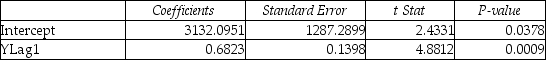 Second-order autoregressive:
 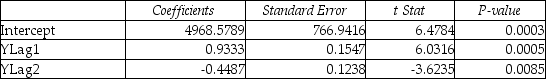 Third-order autoregressive:
 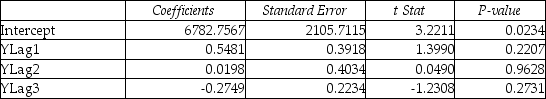 Below is the residual plot of the various models:
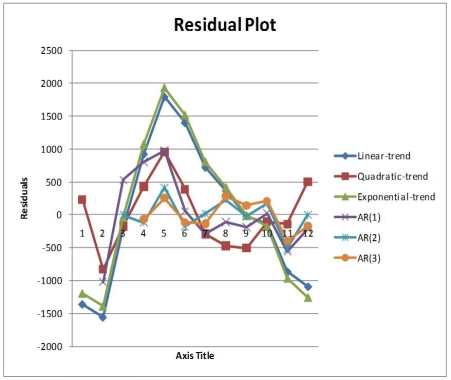
-Referring to Table 16-13,what is your forecast for the 13th month using the exponential-trend model?
Definitions:
Process Variation
The fluctuation or inconsistency in the procedures and outcomes of manufacturing or service delivery, impacting quality and performance.
Quality Function Deployment
A systematic approach to design based on a close awareness of customer desires, translating those desires into the target design.
Product Performance
Evaluates how well a product meets expected standards and satisfies customer needs in terms of quality, reliability, and functionality.
Deploying Quality
The process of implementing and maintaining a level of excellence in products, services, and processes within an organization.
Q10: Referring to Table 14-5,at the 0.01 level
Q14: Referring to Table 14-5,what is the p-value
Q14: Referring to Table 17-2,what is the 90%
Q16: True or False: Referring to Table 15-6,the
Q26: Referring to Table 17-12,what is the p-value
Q105: Referring to Table 16-13,what is the exponentially
Q107: True or False: Referring to Table 14-16,the
Q184: A political pollster randomly selects a sample
Q192: The coefficient of multiple determination <img src="https://d2lvgg3v3hfg70.cloudfront.net/TB2970/.jpg"
Q265: A Paso Robles wine producer wanted to