Examlex

Solved

TABLE 15-4 the Superintendent of a School District Wanted to Predict the Predict

question 68

True/False

TABLE 15-4
The superintendent of a school district wanted to predict the percentage of students passing a sixth-grade proficiency test.She obtained the data on percentage of students passing the proficiency test (% Passing),daily mean of the percentage of students attending class (% Attendance),mean teacher salary in dollars (Salaries),and instructional spending per pupil in dollars (Spending)of 47 schools in the state.
Let Y = % Passing as the dependent variable,X1 = % Attendance,X2 = Salaries and X3 = Spending.
The coefficient of multiple determination ( TABLE 15-4 The superintendent of a school district wanted to predict the percentage of students passing a sixth-grade proficiency test.She obtained the data on percentage of students passing the proficiency test (% Passing),daily mean of the percentage of students attending class (% Attendance),mean teacher salary in dollars (Salaries),and instructional spending per pupil in dollars (Spending)of 47 schools in the state. Let Y = % Passing as the dependent variable,X<sub>1</sub> = % Attendance,X<sub>2</sub> = Salaries and X<sub>3</sub> = Spending. The coefficient of multiple determination (   )of each of the 3 predictors with all the other remaining predictors are,respectively,0.0338,0.4669,and 0.4743. The output from the best-subset regressions is given below:   Following is the residual plot for % Attendance:   Following is the output of several multiple regression models: Model (I):   Model (II):   Model (III):   -True or False: Referring to Table 15-4,there is reason to suspect collinearity between some pairs of predictors. )of each of the 3 predictors with all the other remaining predictors are,respectively,0.0338,0.4669,and 0.4743.
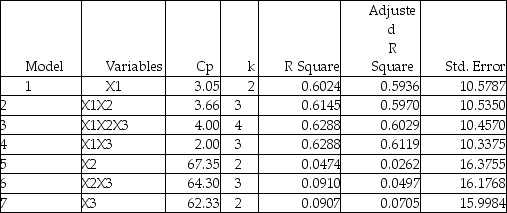
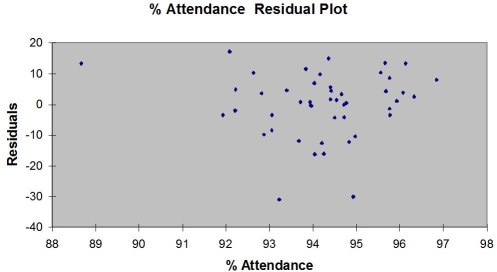
The output from the best-subset regressions is given below: TABLE 15-4 The superintendent of a school district wanted to predict the percentage of students passing a sixth-grade proficiency test.She obtained the data on percentage of students passing the proficiency test (% Passing),daily mean of the percentage of students attending class (% Attendance),mean teacher salary in dollars (Salaries),and instructional spending per pupil in dollars (Spending)of 47 schools in the state. Let Y = % Passing as the dependent variable,X<sub>1</sub> = % Attendance,X<sub>2</sub> = Salaries and X<sub>3</sub> = Spending. The coefficient of multiple determination (   )of each of the 3 predictors with all the other remaining predictors are,respectively,0.0338,0.4669,and 0.4743. The output from the best-subset regressions is given below:   Following is the residual plot for % Attendance:   Following is the output of several multiple regression models: Model (I):   Model (II):   Model (III):   -True or False: Referring to Table 15-4,there is reason to suspect collinearity between some pairs of predictors. Following is the residual plot for % Attendance: TABLE 15-4 The superintendent of a school district wanted to predict the percentage of students passing a sixth-grade proficiency test.She obtained the data on percentage of students passing the proficiency test (% Passing),daily mean of the percentage of students attending class (% Attendance),mean teacher salary in dollars (Salaries),and instructional spending per pupil in dollars (Spending)of 47 schools in the state. Let Y = % Passing as the dependent variable,X<sub>1</sub> = % Attendance,X<sub>2</sub> = Salaries and X<sub>3</sub> = Spending. The coefficient of multiple determination (   )of each of the 3 predictors with all the other remaining predictors are,respectively,0.0338,0.4669,and 0.4743. The output from the best-subset regressions is given below:   Following is the residual plot for % Attendance:   Following is the output of several multiple regression models: Model (I):   Model (II):   Model (III):   -True or False: Referring to Table 15-4,there is reason to suspect collinearity between some pairs of predictors. Following is the output of several multiple regression models:
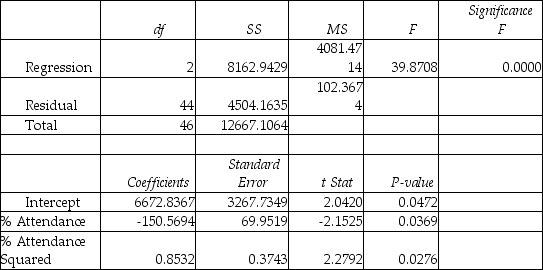
Model (I): TABLE 15-4 The superintendent of a school district wanted to predict the percentage of students passing a sixth-grade proficiency test.She obtained the data on percentage of students passing the proficiency test (% Passing),daily mean of the percentage of students attending class (% Attendance),mean teacher salary in dollars (Salaries),and instructional spending per pupil in dollars (Spending)of 47 schools in the state. Let Y = % Passing as the dependent variable,X<sub>1</sub> = % Attendance,X<sub>2</sub> = Salaries and X<sub>3</sub> = Spending. The coefficient of multiple determination (   )of each of the 3 predictors with all the other remaining predictors are,respectively,0.0338,0.4669,and 0.4743. The output from the best-subset regressions is given below:   Following is the residual plot for % Attendance:   Following is the output of several multiple regression models: Model (I):   Model (II):   Model (III):   -True or False: Referring to Table 15-4,there is reason to suspect collinearity between some pairs of predictors. Model (II): TABLE 15-4 The superintendent of a school district wanted to predict the percentage of students passing a sixth-grade proficiency test.She obtained the data on percentage of students passing the proficiency test (% Passing),daily mean of the percentage of students attending class (% Attendance),mean teacher salary in dollars (Salaries),and instructional spending per pupil in dollars (Spending)of 47 schools in the state. Let Y = % Passing as the dependent variable,X<sub>1</sub> = % Attendance,X<sub>2</sub> = Salaries and X<sub>3</sub> = Spending. The coefficient of multiple determination (   )of each of the 3 predictors with all the other remaining predictors are,respectively,0.0338,0.4669,and 0.4743. The output from the best-subset regressions is given below:   Following is the residual plot for % Attendance:   Following is the output of several multiple regression models: Model (I):   Model (II):   Model (III):   -True or False: Referring to Table 15-4,there is reason to suspect collinearity between some pairs of predictors. Model (III): TABLE 15-4 The superintendent of a school district wanted to predict the percentage of students passing a sixth-grade proficiency test.She obtained the data on percentage of students passing the proficiency test (% Passing),daily mean of the percentage of students attending class (% Attendance),mean teacher salary in dollars (Salaries),and instructional spending per pupil in dollars (Spending)of 47 schools in the state. Let Y = % Passing as the dependent variable,X<sub>1</sub> = % Attendance,X<sub>2</sub> = Salaries and X<sub>3</sub> = Spending. The coefficient of multiple determination (   )of each of the 3 predictors with all the other remaining predictors are,respectively,0.0338,0.4669,and 0.4743. The output from the best-subset regressions is given below:   Following is the residual plot for % Attendance:   Following is the output of several multiple regression models: Model (I):   Model (II):   Model (III):   -True or False: Referring to Table 15-4,there is reason to suspect collinearity between some pairs of predictors.
-True or False: Referring to Table 15-4,there is reason to suspect collinearity between some pairs of predictors.


Definitions:

Dividends

Payments made by a corporation to its shareholder members, often derived from the company's profits.

Accounting Equation

The foundation of double-entry bookkeeping, stating that Assets = Liabilities + Owners' Equity.

Excess Space

Excess space refers to the additional or unused space within a property or facility that exceeds the current needs of the occupants or users.

Materiality Constraint

An accounting principle that allows for the exclusion of insignificant financial information from reports because it would not impact decision-making.

Related Questions