TABLE 14-15
The superintendent of a school district wanted to predict the percentage of students passing a sixth-grade proficiency test.She obtained the data on percentage of students passing the proficiency test (% Passing),mean teacher salary in thousands of dollars (Salaries),and instructional spending per pupil in thousands of dollars (Spending)of 47 schools in the state.
Following is the multiple regression output with Y = % Passing as the dependent variable,X1 = Salaries and X2 = Spending: 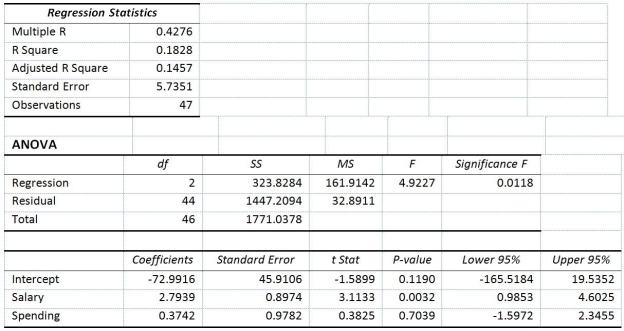
-True or False: Referring to Table 14-15,the null hypothesis H0 : β1 = β2 = 0 implies that percentage of students passing the proficiency test is not related to either of the explanatory variables.
Definitions:
Variable Utilities
A classification of utility costs that change in relation to production volume or operational activity.
Human Behavior
The study of how individuals act within societies, influenced by factors such as emotions, culture, and environment.
Budgetary Slack
The practice of underestimating revenues or overestimating costs when preparing a budget to create a buffer.
Budget Process
The procedure by which an organization or individual creates a plan to allocate resources and monitor financial activity over a specified period.
Q11: Referring to Table 13-3,the director of cooperative
Q20: Referring to Table 16-16,what is the Paasche
Q30: Referring to Table 16-15,what is the Paasche
Q35: True or False: Referring to Table 16-10,the
Q39: Referring to Table 14-10,the proportion of the
Q72: True or False: Referring to Table 13-10,it
Q152: Referring to Table 13-5,the correlation coefficient is
Q175: True or False: Referring to Table 14-15,the
Q205: Referring to Table 13-9,the degrees of freedom
Q260: Referring to Table 14-17,which of the following