TABLE 14-17
Given below are results from the regression analysis where the dependent variable is the number of weeks a worker is unemployed due to a layoff (Unemploy)and the independent variables are the age of the worker (Age)and a dummy variable for management position (Manager: 1 = yes,0 = no).
The results of the regression analysis are given below: 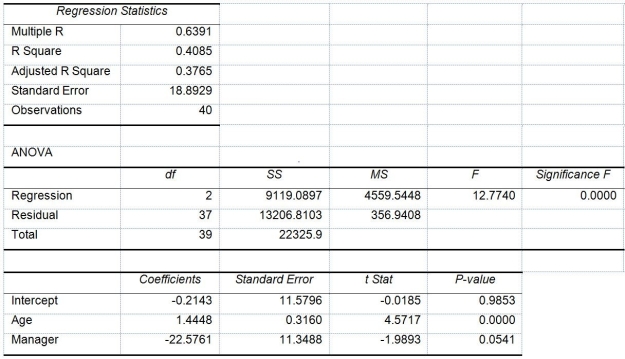
-True or False: Referring to Table 14-17,you can conclude that,holding constant the effect of the other independent variable,age has no impact on the mean number of weeks a worker is unemployed due to a layoff at a 5% level of significance if we use only the information of the 95% confidence interval estimate for the effect of a one year increase in age on the mean number of weeks a worker is unemployed due to a layoff.
Definitions:
Budget Constraint
A representation of all the combinations of goods and services that a consumer can afford with a fixed income and prices.
Indifference Curve
A graph representing different bundles of goods between which a consumer is indifferent, showing combinations that give the consumer the same level of satisfaction.
Income
The amount of money or its equivalent received during a period of time in exchange for labor, goods, or services, or as profit on capital.
Indifference Curves
Graphical representations in economics showing combinations of goods among which a consumer is indifferent, helping to analyze consumer choices.
Q10: Referring to Table 14-5,at the 0.01 level
Q11: Referring to Table 15-1,what is the correct
Q31: Referring to Table 16-15,what is the unweighted
Q34: True or False: Referring to Table 12-2,the
Q35: True or False: The base period should
Q53: True or False: Referring to Table 15-6,the
Q116: The width of the prediction interval for
Q187: Referring to Table 14-3,one economy in the
Q191: True or False: The Regression Sum of
Q310: True or False: A regression had the