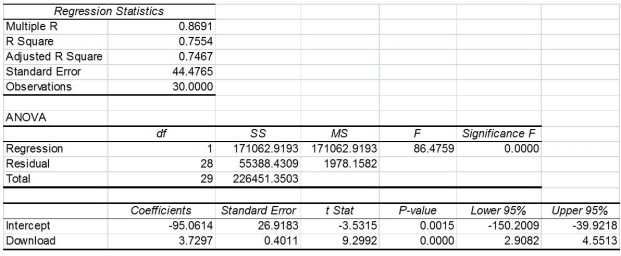
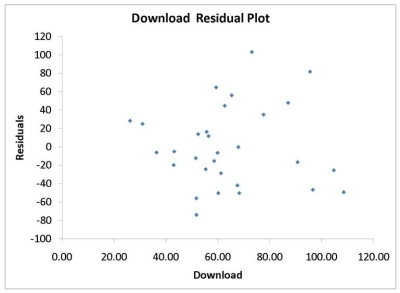
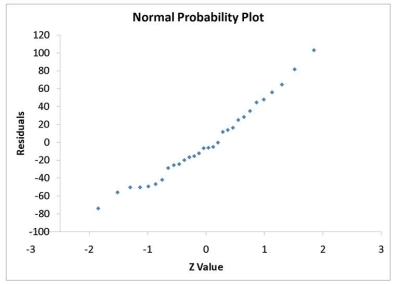
TABLE 13-11
A computer software developer would like to use the number of downloads (in thousands) for the trial version of his new shareware to predict the amount of revenue (in thousands of dollars) he can make on the full version of the new shareware. Following is the output from a simple linear regression along with the residual plot and normal probability plot obtained from a data set of 30 different sharewares that he has developed:


-Referring to Table 13-11, what are the lower and upper limits of the 95% confidence interval estimate for population slope?
Definitions:
Q2: Referring to Table 13-1,interpret the estimate of
Q8: True or False: The McNemar test is
Q8: Referring to Table 13-10,what is the p-value
Q26: Referring to Table 13-10,what is the p-value
Q71: Referring to Table 13-3,the director of cooperative
Q92: Which of the following assumptions concerning the
Q119: Referring to Table 13-4,the standard error of
Q120: Referring to Table 14-15,what are the lower
Q129: A completely randomized design<br>A)has only one factor
Q182: Referring to Table 14-18,which of the following