TABLE 12-17
Three new different models of compact SUVs have just arrived at the market.You are interested in comparing the gas mileage performance of all three models to see if they are the same.A partial computer output for twelve compact SUVs of each model is given below: 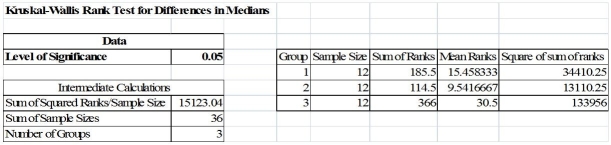 You are told that the gas mileage population distributions for all three models are not normally distributed.
-Referring to Table 12-17,what is the critical value of the Kruskal-Wallis test statistic?
Definitions:
AVC Curve
A graph that represents the average variable cost of producing each quantity of output, showing how these costs vary with changes in output levels.
Short-Run Situation
A period in which at least one of a firm's inputs is fixed, limiting its capacity to adjust output levels quickly.
Marginal Revenue
The increase in revenue a business gets from the sale of an extra unit of a product or service.
Marginal Cost
The incremental cost of producing an additional unit of a product or service.
Q7: Referring to Table 12-20,what type of test
Q55: True or False: Referring to Table 11-3,based
Q112: The Y-intercept (b<sub>0</sub>)represents the<br>A)predicted value of Y
Q114: The Journal of Business Venturing reported on
Q117: True or False: The procedure for the
Q120: Referring to Table 14-15,what are the lower
Q147: In testing for differences between the means
Q168: Referring to Table 10-2,the researcher was attempting
Q172: True or False: Referring to Table 12-11,the
Q189: Referring to Table 13-5,the prediction for a