Credit Hours
The College of Business at The State University of California produced 3,400 credit hours during Spring Semester,2011he number and percentage of credit hours produced by each of the four departments in the College of Business is shown below.
The following three-dimensional pie chart was constructed from the table above. 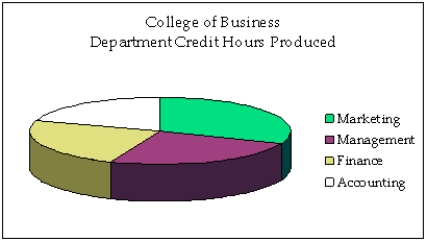
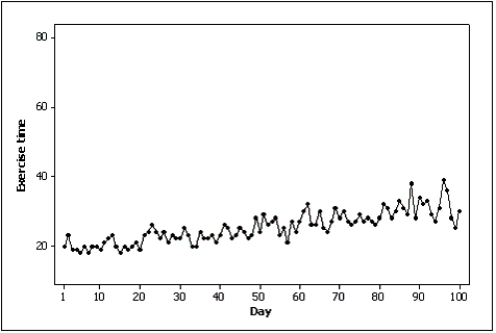
-Samantha recorded her amount of exercise time (in minutes)for 100 days.Both of the line charts below were created based on her same data set.Which line chart makes her exercise times look more variable and why? 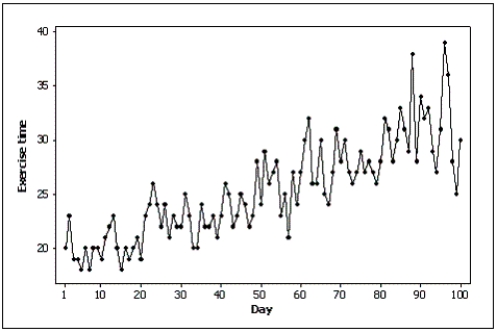
Definitions:
Sampling Bias
A distortion in the outcome of a study due to the method in which samples are collected, resulting in a non-representative sample of the population.
Response Set
A tendency in survey respondents to answer questions in a particular pattern, regardless of the content.
Halo Effect
A cognitive bias where perceptions of one quality lead to unjustified positive or negative assessments of other qualities.
Experimenter Bias
A bias where researchers' expectations influence the outcome of a study unintentionally.
Q3: Lower labour costs can be a reflection
Q25: Subordinates,as a source of performance information,are generally
Q28: The effect of making the slope of
Q31: Which of the following statements about acceptability
Q33: An intervention that explicitly focuses on the
Q52: {Test Scores Narrative} What do these statistics
Q59: Which of the following is NOT a
Q63: Give an example of interval data that
Q102: The histogram below has a shape that
Q123: According to the stem-and-leaf plot below,this