What does the vertical line in the normal distribution represent? 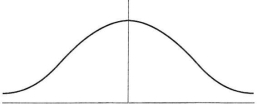
Definitions:
Subcategories
Specific groups or divisions within a larger category, used to further classify items or data.
Box Plot
A graphical representation of statistical data based on the minimum, first quartile, median, third quartile, and maximum, showcasing the distribution's spread and central tendency.
Median
The middle value in a data set, which divides the data into two halves with an equal number of observations above and below it.
Mean
The average value of a set of numbers, calculated by dividing the sum of all the values by the number of values.
Q3: When a test is being developed, the
Q13: A learner's expectancy about success in the
Q15: What are the four steps required to
Q16: If you administer a test it is
Q18: It is not true that curriculum-based assessment
Q22: IEP team members are concerned that a
Q24: In a university, all students are given
Q41: Mrs. Rodriguez is using the PNDs to
Q60: A student in class has been rubbing
Q63: Rank order the following data. Complete a