The diagram below shows desired aggregate expenditure for a hypothetical economy.Assume the following features of this economy: • marginal propensity to consume (mpc) = 0.80
• net tax rate (t) = 0.15
• no foreign trade
• fixed price level
• all expenditure and income figures are in billions of dollars. 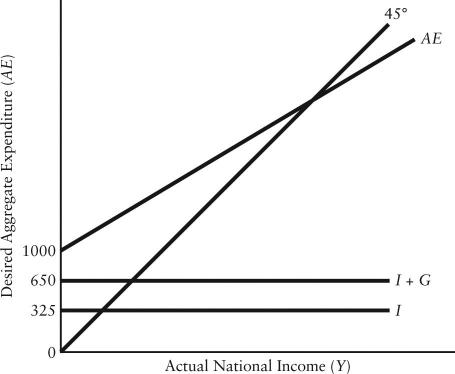 FIGURE 22-3
Refer to Figure 22-3.Which of the following correctly describes the consumption function for this economy?
Definitions:
Q14: Long-run economic growth can help alleviate the
Q18: The diagram below shows alternate paths for
Q20: Consider the circular flow of income and
Q20: A variable that is a "stock"<br>A)is measured
Q26: The three main reasons that Canada's real
Q81: Suppose that at the end of a
Q103: The table below shows total output for
Q104: Suppose there is a drop in the
Q104: Why is real GDP not a good
Q136: If the economy is experiencing an inflationary